


A successful cricket team in ODI World Cup is one that has the most trophies, most wins, and, finally, the highest win percentage. Which team tops all these metrics? Or a team that has won the most World Cup trophies, the most number of wins and a successful win percentage. “Australia” is the right answer.
Team Australia is the most successful team in ODI world cup history as they have the most trophies, matches, and the highest win percentage in ODI World Cup history.
What about the other teams? Pakistan, India, Sri Lanka, and West Indies. With regard to South Asian cricket teams India, Pakistan, and Sri Lanka, yes, they have improved strongly, with an overall greater number of wins in each World Cup.
The West Indian team, once the king of ODI cricket, is no longer as strong as in the 1970s. Let us see, What will happen in the 2023 ODI World Cup? Which team will win the World Cup in 2023? Now we will look at the most successful teams in ODI World Cup history.
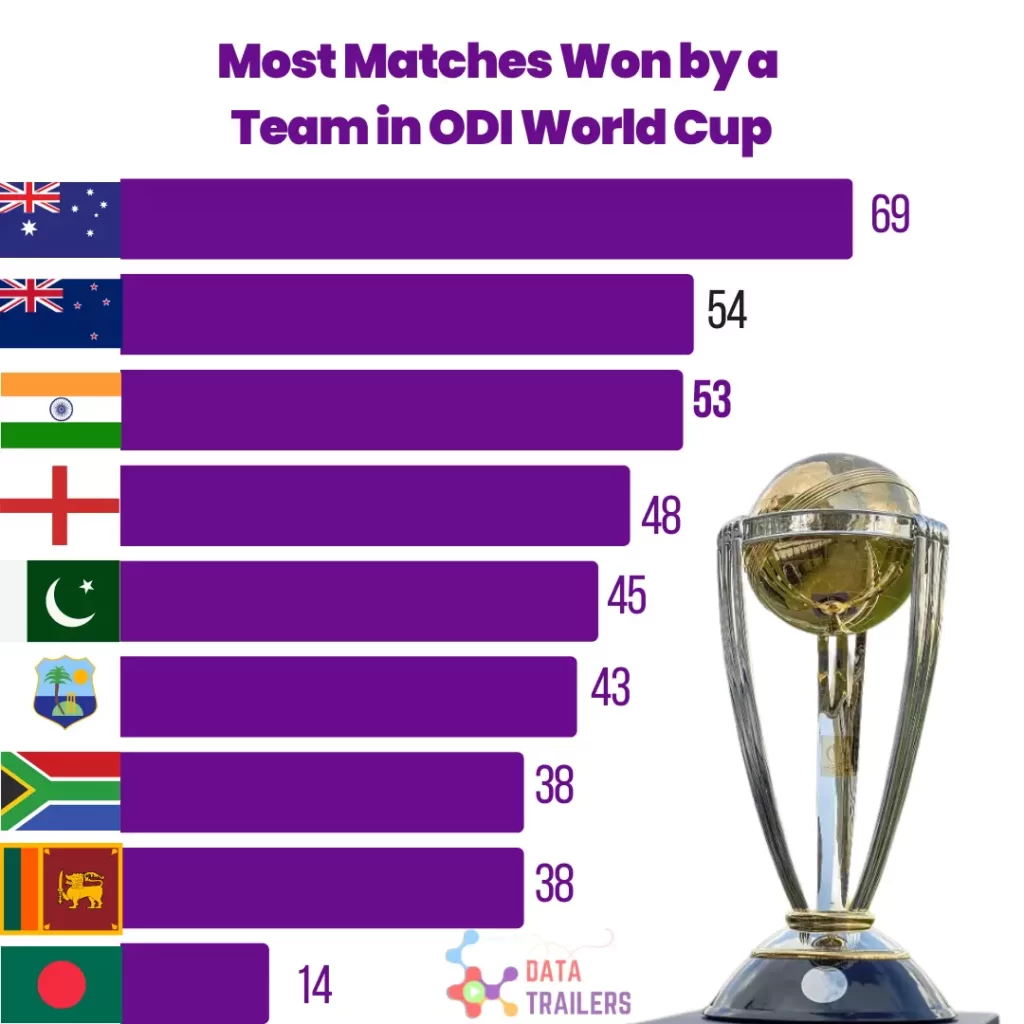
Most Matches Won by a Team in ODI WorldCup
Aussie has won the highest number of matches in One-day international world cup history. They have appeared in 94 matches in ODI WC from 1975 to 2019 and won 69 matches. India is the most successful Asian team with 53 wins in ODI world cup.
| Team | Span | Matches | Won | Lost | Tied | N/R |
|---|---|---|---|---|---|---|
| Australia | 1975-2019 | 94 | 69 | 23 | 1 | 1 |
| New Zealand | 1975-2019 | 89 | 54 | 33 | 1 | 1 |
| India | 1975-2019 | 84 | 53 | 29 | 1 | 1 |
| England | 1975-2019 | 83 | 48 | 32 | 2 | 1 |
| Pakistan | 1975-2019 | 79 | 45 | 32 | 0 | 2 |
| West Indies | 1975-2019 | 80 | 43 | 35 | 0 | 2 |
| South Africa | 1992-2019 | 64 | 38 | 23 | 2 | 1 |
| Sri Lanka | 1975-2019 | 80 | 38 | 39 | 1 | 2 |
| Bangladesh | 1999-2019 | 40 | 14 | 25 | 0 | 1 |
| Zimbabwe | 1983-2015 | 57 | 11 | 42 | 1 | 3 |
Most Successful Teams with Highest Win Percentage in ODI WC
Australia | 73 %
Australia is the most successful team in 50 over World Cup history. Between 1975 and 2019, Australia won 69 of 94 World Cup matches, with 23 losses. Therefore, 73 win percentage is one of the highest ratios recorded by any team in ODI World Cup history.
Australia has a win-loss ratio of 03, showing how strong the Australians are in the ODI World Cup. Have you ever imagined winning 22 World Cup matches in a row? Yes, Australia has done this in the 2003 and 2007 World Cups. They won all of the 22 matches played in both WCs.
Here are the individual ODI World Cup stats of the Australian team from the past.
| World Cup | Matches | Won | Lost | Tied | N/R | W/L | win % |
|---|---|---|---|---|---|---|---|
| 1975 | 5 | 3 | 2 | 0 | 0 | 1.5 | 60 |
| 1979 | 3 | 1 | 2 | 0 | 0 | 0.5 | 33 |
| 1983 | 6 | 2 | 4 | 0 | 0 | 0.5 | 33 |
| 1987 | 8 | 7 | 1 | 0 | 0 | 7 | 87 |
| 1992 | 8 | 4 | 4 | 0 | 0 | 1 | 50 |
| 1996 | 7 | 5 | 2 | 0 | 0 | 2.5 | 71 |
| 1999 | 10 | 7 | 2 | 1 | 0 | 3.5 | 70 |
| 2003 | 11 | 11 | 0 | 0 | 0 | – | 100 |
| 2007 | 11 | 11 | 0 | 0 | 0 | – | 100 |
| 2011 | 7 | 4 | 2 | 0 | 1 | 2 | 57 |
| 2015 | 8 | 7 | 1 | 0 | 0 | 7 | 87 |
| 2019 | 10 | 7 | 3 | 0 | 0 | 2.333 | 70 |
India | 63 %
Team India has 63 % win ratio in ODI World Cup history. Overall, Indian team won 53 out of 84 total matches in the ODI World Cup from 1975 to 2019. How many matches team India have lost in the World Cup? It’s 29 in number from 1975 to 2019.
Statistically, Indian teams win to loss ratio is 1.8, which is second best after Australia. So, we can say that the Indian team is the second most successful team in ODI WC history after Australia.
Read More: How many times India has won ODI World Cup?
India had an outstanding record in World Cup history. They won the 2011 World Cup, 1983 World Cup and reached the final of the 2003 World Cup.
| World Cup | Matches | Won | Lost | Tied | N/R | W/L | Win % |
|---|---|---|---|---|---|---|---|
| 1975 | 3 | 1 | 2 | 0 | 0 | 0.5 | 33 |
| 1979 | 3 | 0 | 3 | 0 | 0 | 0 | 0 |
| 1983 | 8 | 6 | 2 | 0 | 0 | 3 | 75 |
| 1987 | 7 | 5 | 2 | 0 | 0 | 2.5 | 71 |
| 1992 | 8 | 2 | 5 | 0 | 1 | 0.4 | 25 |
| 1996 | 7 | 4 | 3 | 0 | 0 | 1.333 | 57 |
| 1999 | 8 | 4 | 4 | 0 | 0 | 1 | 50 |
| 2003 | 11 | 9 | 2 | 0 | 0 | 4.5 | 81 |
| 2007 | 3 | 1 | 2 | 0 | 0 | 0.5 | 33 |
| 2011 | 9 | 7 | 1 | 1 | 0 | 7 | 77 |
| 2015 | 8 | 7 | 1 | 0 | 0 | 7 | 87 |
| 2019 | 9 | 7 | 2 | 0 | 0 | 3.5 | 77 |
New Zealand | 60 %
New Zealand has 60 % Win ratio in ODI World Cup history. Since the 1975 ODI World Cup, The Kiwi cricket team has won 54 of 89 matches while losing 33.
Although the New Zealand team has never won a World Cup, they have made it to the finals and semi-finals on several occasions.
| Worl Cup | Matches | Won | Lost | Tied | NR | W/L | Win % |
|---|---|---|---|---|---|---|---|
| 1975 | 4 | 2 | 2 | 0 | 0 | 1 | 50 |
| 1979 | 4 | 2 | 2 | 0 | 0 | 1 | 50 |
| 1983 | 6 | 3 | 3 | 0 | 0 | 1 | 50 |
| 1987 | 6 | 2 | 4 | 0 | 0 | 0.5 | 33 |
| 1992 | 9 | 7 | 2 | 0 | 0 | 3.5 | 77 |
| 1996 | 6 | 3 | 3 | 0 | 0 | 1 | 50 |
| 1999 | 9 | 4 | 4 | 0 | 1 | 1 | 44 |
| 2003 | 8 | 5 | 3 | 0 | 0 | 1.666 | 62 |
| 2007 | 10 | 7 | 3 | 0 | 0 | 2.333 | 70 |
| 2011 | 8 | 5 | 3 | 0 | 0 | 1.666 | 62 |
| 2015 | 9 | 8 | 1 | 0 | 0 | 8 | 88 |
| World Cup | 10 | 6 | 3 | 1 | 0 | 2 | 60 |
New Zealand had an outstanding World Cup 2015, losing only one match out of a total of 09. In World Cup 2019, they repeated the same performance but remained unfortunate to win the trophy. How has been there journey so far from 1975 to 2019? Here are the World Cup stats of Kiwi’s team.
South Africa | 59 %
All of you will be surprised to see South Africa at number 04 on the list of Successful teams. Yes, it is because South Africa has a win percentage or ratio of 59. It shows how well the South African team has performed in their ODI World Cup history.
| World Cup | Matches | Won | Lost | Tied | N/R | W/L | Win % |
|---|---|---|---|---|---|---|---|
| 1992 | 9 | 5 | 4 | 0 | 0 | 1.25 | 55 |
| 1996 | 6 | 5 | 1 | 0 | 0 | 5 | 83 |
| 1999 | 9 | 6 | 2 | 1 | 0 | 3 | 66 |
| 2003 | 6 | 3 | 2 | 1 | 0 | 1.5 | 50 |
| 2007 | 10 | 6 | 4 | 0 | 0 | 1.5 | 60 |
| 2011 | 7 | 5 | 2 | 0 | 0 | 2.5 | 71 |
| 2015 | 8 | 5 | 3 | 0 | 0 | 1.666 | 62 |
| 2019 | 9 | 3 | 5 | 0 | 1 | 0.6 | 33 |
There is another twist: despite a strong start to each World Cup, South Africa has been removed from the semi-finals or quarter-finals. This is why they are called chokers. They never won a World Cup trophy but have an excellent winning record. They won 38 out of 64 World Cup matches in history.
England | 57 %
Even though England is the country where cricket originated many years back, the English team’s first Cricket World Cup victory came in 2019. Overall, England has a win percentage of 57 and is ranked in fifth position in terms of win percentage. Moreover, the England team has won 48 matches out of a total 83 World Cup matches, with 32 losses from 1975 to 2019 World Cup.
World Cup 2023 will be a tough battle for defending champion England as it will be held in India. England fans will be hoping for a repeat of their team’s performance in the 2023 World Cup. Here is the list of England World Cup stats till the 2019 World Cup.
| Date | Matches | Won | Lost | Tied | NR | W/L | Win % |
|---|---|---|---|---|---|---|---|
| 1975 | 4 | 3 | 1 | 0 | 0 | 3 | 75 |
| 1979 | 5 | 4 | 1 | 0 | 0 | 4 | 80 |
| 1983 | 7 | 5 | 2 | 0 | 0 | 2.5 | 71 |
| 1987 | 8 | 5 | 3 | 0 | 0 | 1.666 | 62 |
| 1992 | 10 | 6 | 3 | 0 | 1 | 2 | 60 |
| 1996 | 6 | 2 | 4 | 0 | 0 | 0.5 | 33 |
| 1999 | 5 | 3 | 2 | 0 | 0 | 1.5 | 60 |
| 2003 | 5 | 3 | 2 | 0 | 0 | 1.5 | 60 |
| 2007 | 9 | 5 | 4 | 0 | 0 | 1.25 | 55 |
| 2011 | 7 | 3 | 3 | 1 | 0 | 1 | 42 |
| 2015 | 6 | 2 | 4 | 0 | 0 | 0.5 | 33 |
| 2019 | 11 | 7 | 3 | 1 | 0 | 2.333 | 63 |
Pakistan | 56 %
Pakistan is one of the most unpredictable teams in World Cup history. Their only World Cup victory, in 1992, was seen in unanticipated circumstances. Pakistan has 56 win percentage in World Cup history. They won 45 matches out of 79, losing 32 from 1975 to 2019 WC. World Cup 1975 was the most successful for Pakistan in terms of match wins. Pakistan lost only 01 matches out of 4 matches in the World Cup 1975 held in England.
Read More: How many times Pakistan has won ODI World Cup?
| World Cup | Matches | Won | Lost | Tied | NR | W/L | Win % |
|---|---|---|---|---|---|---|---|
| 1975 | 3 | 1 | 2 | 0 | 0 | 0.5 | 33 |
| 1979 | 4 | 2 | 2 | 0 | 0 | 1 | 50 |
| 1983 | 7 | 3 | 4 | 0 | 0 | 0.75 | 42 |
| 1987 | 7 | 5 | 2 | 0 | 0 | 2.5 | 71 |
| 1992 | 10 | 6 | 3 | 0 | 1 | 2 | 60 |
| 1996 | 6 | 4 | 2 | 0 | 0 | 2 | 66 |
| 1999 | 10 | 6 | 4 | 0 | 0 | 1.5 | 60 |
| 2003 | 6 | 2 | 3 | 0 | 1 | 0.666 | 33 |
| 2007 | 3 | 1 | 2 | 0 | 0 | 0.5 | 33 |
| 2011 | 8 | 6 | 2 | 0 | 0 | 3 | 75 |
| 2015 | 7 | 4 | 3 | 0 | 0 | 1.333 | 47 |
| 2019 | 8 | 5 | 3 | 0 | 0 | 1.666 | 62 |
West Indies| 53 %
West Indies was one of the most successful teams of ODI Cricket in early years. Their first two World Cup victories in 1975 and 1979 show their strong cricket tradition. West Indies went undefeated in both World Cups, losing no match. Moreover, things start to go on the negative side after losing legendary cricketers.
Overall, West Indies won 43 out of the total 80 matches, losing 35 with a win percentage 53. Here are the World Cup stats of West Indies from 1975 to 2019.
| World Cup | Matches | Won | Lost | Tied | N/R | W/L |
|---|---|---|---|---|---|---|
| 1975 | 5 | 5 | 0 | 0 | 0 | – |
| 1979 | 4 | 4 | 0 | 0 | 0 | – |
| 1983 | 8 | 6 | 2 | 0 | 0 | 3 |
| 1987 | 6 | 3 | 3 | 0 | 0 | 1 |
| 1992 | 8 | 4 | 4 | 0 | 0 | 1 |
| 1996 | 6 | 3 | 3 | 0 | 0 | 1 |
| 1999 | 5 | 3 | 2 | 0 | 0 | 1.5 |
| 2003 | 6 | 3 | 2 | 0 | 1 | 1.5 |
| 2007 | 9 | 4 | 5 | 0 | 0 | 0.8 |
| 2011 | 7 | 3 | 4 | 0 | 0 | 0.75 |
| 2015 | 7 | 3 | 4 | 0 | 0 | 0.75 |
| 2019 | 9 | 2 | 6 | 0 | 1 | 0.333 |
Sri Lanka | 47 %
Sri Lank is one of the best Asian ODI XI after India, and Pakistan. Their best performance came in the 1996 World Cup when they won all six matches and took home the trophy. Overall, Sri Lankan team won 38 out of 80 matches, losing 39 with a win percentage of 47.
In the 2011 World Cup, Sri Lanka tried to repeat the performance of 1996 WC and reached the final of World Cup. They faced the Indian team in the final and lost the match. Therefore, Sri Lanka could be a very dangerous team in 2023 ODI World Cup.
| World Cup | Matches | Won | Lost | Tied | NR | W/L | Win % |
|---|---|---|---|---|---|---|---|
| 1975 | 3 | 0 | 3 | 0 | 0 | 0 | 0 |
| 1979 | 2 | 1 | 1 | 0 | 0 | 1 | 50 |
| 1983 | 6 | 1 | 5 | 0 | 0 | 0.2 | 16 |
| 1987 | 6 | 0 | 6 | 0 | 0 | 0 | 0 |
| 1992 | 8 | 2 | 5 | 0 | 1 | 0.4 | 25 |
| 1996 | 6 | 6 | 0 | 0 | 0 | – | 0 |
| 1999 | 5 | 2 | 3 | 0 | 0 | 0.666 | 40 |
| 2003 | 10 | 5 | 4 | 1 | 0 | 1.25 | 50 |
| 2007 | 11 | 8 | 3 | 0 | 0 | 2.666 | 72 |
| 2011 | 9 | 6 | 2 | 0 | 1 | 3 | 66 |
| 2015 | 7 | 4 | 3 | 0 | 0 | 1.333 | 57 |
| 2019 | 7 | 3 | 4 | 0 | 0 | 0.75 | 42 |
Bangladesh | 35 %
Bangladesh played its first World Cup in 1999. They have several records of famous World Cup upsets in World Cup history. World Cup 2003 was not a good World Cup for Bangladesh because they lost all 06 matches played in the World Cup. In all other World Cups, they won more than one match, which shows their fighting spirit as an Asian cricket team.
Overall, Bangladesh won 14 out of 40 matches, losing 25 matches till 2019 World Cup.
| World Cup | Matches | Won | Lost | NR | Tie | W/L | Win % |
|---|---|---|---|---|---|---|---|
| 1999 | 5 | 2 | 3 | 0 | 0 | 0.666 | 40 |
| 2003 | 6 | 0 | 5 | 0 | 1 | 0 | 0 |
| 2007 | 9 | 3 | 6 | 0 | 0 | 0.5 | 33 |
| 2011 | 6 | 3 | 3 | 0 | 0 | 1 | 50 |
| 2015 | 6 | 3 | 3 | 0 | 0 | 1 | 50 |
| 2019 | 8 | 3 | 5 | 0 | 0 | 0.6 | 37 |
Zimbabwe | 19 %
After Bangladesh, Zimbabwe is the least successful team in World Cup history. Overall, Zimbabwe has 19 % Win percentage in World Cup history. They won only 11 out of 57 matches, losing 42.
Zimbabwe’s first World Cup was in 1983, after which they consistently played several World Cups. World Cup 2007 and 1987 were really bad tournaments for Zimbabwe as they could not win any matches.
| World Cup | Matches | Won | Lost | Tie | NR | W/L | Win % |
|---|---|---|---|---|---|---|---|
| 1983 | 6 | 1 | 5 | 0 | 0 | 0.2 | 16 |
| 1987 | 6 | 0 | 6 | 0 | 0 | 0 | 0 |
| 1992 | 8 | 1 | 7 | 0 | 0 | 0.142 | 12 |
| 1996 | 6 | 1 | 4 | 0 | 1 | 0.25 | 16 |
| 1999 | 8 | 3 | 4 | 0 | 1 | 0.75 | 37 |
| 2003 | 8 | 2 | 5 | 0 | 1 | 0.4 | 25 |
| 2007 | 3 | 0 | 2 | 1 | 0 | 0 | 0 |
| 2011 | 6 | 2 | 4 | 0 | 0 | 0.5 | 33 |
| 2015 | 6 | 1 | 5 | 0 | 0 | 0.2 | 16 |
Afghanistan | 6 %
Afghanistan’s initial Cricket rise in cricket was in T20 format, but they have participated in ODI World Cup. Their first World Cup was in 2015. Since then have won a percentage of only 06 percent, which is the lowest among other teams. Out of total of 15 matches, they won only one match, losing 14 till the 2019 WC.
